


February 07, 2024
Joint research exploring future seasonality of mortality under climate change ~Collaboration between Nagasaki University and the University of Tokyo published in The Lancet Planetary Health~
■POINTS
●Projects daily mortality from 2000 to 2099 based on four climate change scenarios in different climate zones in 43 countries and areas (707 locations)
● Projects possible changes in the seasonality of mortality associated with climate change (global warming)
●Mortality is projected to increase in the warm season and decrease in the cold season from the 2000s to the 2090s under all climate change scenarios and in all climate zones.
■OUTLINE
Nagasaki University and the University of Tokyo, in an international collaborative study, have identified a possible future change in the seasonality of mortality associated with climate change (the researchers from each university who played a central role in the study are listed below).
〇Associate Professor Lina Madaniyazi, Graduate School of Tropical Medicine and Global Health, Nagasaki University
〇Professor Masahiro Hashizume, School of International Health, Graduate School of Medicine, The University of Tokyo
This landmark study, published in The Lancet Planetary Health, offers a systematic and comprehensive assessment of future changes in mortality seasonality across diverse climate zones.
1. Background and aims
The well-documented seasonality of mortality typically reveals higher death in cold seasons than in warm ones. Amidst global warming concerns, discussions continue about whether the rise in temperatures will diminish mortality during cold seasons while potentially increasing it in warm seasons, thus altering the seasonality of mortality. The objective of this study is to deliver a thorough and systematic evaluation of potential future changes in the seasonal variation, or seasonality, of mortality across diverse climate zones.
2. Study Methods
Daily time series data on mean temperature and mortality (all causes or non-external causes) was gathered through the Multi-Country Multi-City Collaborative (MCC) Research Network. Daily mortality was projected from 2000 to 2099, employing four climate change scenarios aligned with escalating emissions (Shared Socioeconomic Pathways [SSP] scenarios SSP1-2.6, SSP2-4.5, SSP3-7.0, and SSP5-8.5). The seasonality in projected mortality was compared between decades by its shape, timings (the day-of-year) of minimum (trough) and maximum (peak) mortality, as well as the sizes (peak-to-trough ratio and attributable fraction).
3. Key Findings:
ー This study examined 126,809,537 deaths from 707 locations within 43 countries or areas, aggregated into four climate zones (arid, continental, temperate, and tropical) (Figure 1).
ー Over the period from 2000 to 2099, the annual mean temperature across 707 locations is expected to rise by 1.35°C, 2.73°C, 4.26°C, and 5.55°C under the scenarios of SSP1-2.6, SSP2-4.5, SSP3-7.0, and SSP5-8.5, respectively.
ー Under all four SSP scenarios, the projections showed an increase in mortality during the warm seasons and a decrease in mortality during the cold seasons from the 2000s to the 2090s in the arid, temperate, and continental zones. However, mortality is projected to remain high during the cold seasons in these zones.
ー This trend intensifies from scenarios with low emission to those high emissions, eventually reshaping seasonality under the highest emission scenario. This involves a shift in mortality peak from cold to warm seasons and an amplified impact of seasonality (i.e., attributable fraction) by the end of the century, with varying impacts across different climate zones (Figure 2).
ー Comparing the 2090s with the 2000s, the shift in peak-to-trough ratio (on a relative scale) ranged from 0.96 to 1.11, and the change in attributable fraction ranged from 0.002% to 0.06% under the SSP5-8.5 (highest emission) scenario.
4. Public health implications:
The findings emphasize the imperative for healthcare systems to prepare for changing seasonal patterns in mortality, anticipating increased demand during warm seasons and sustained demand during cold seasons, especially in temperate, continental, and arid climates.
5. Global Collaboration:
This collaborative effort involves researchers from more than 43 countries or areas through the Multi-Country Multi-City Collaborative Research Network, such as the London School of Hygiene and Tropical Medicine and Harvard University. This initiative fosters a diverse and comprehensive approach to understanding climate change’s nuanced impact on mortality patterns, contributing to the field of planetary health.
6. Funding:
This study was primarily supported by the Environment Research and Technology Development Fund (JPMEERF20231007) of the Environmental Restoration and Conservation Agency, provided by the Ministry of the Environment of Japan.
7. Publication Details:
Read the full study " Seasonality of mortality under climate change: a multicountry projection study " in The Lancet Planetary Health (https://www.thelancet.com/journals/lanplh/article/PII S2542-5196(23)00269-3/fulltext), going live on February 7 at 08:30 (Japan time).
8. Note:
Shared Socioeconomic Pathways [SSP] scenarios SSP1-2.6, SSP2-4.5, SSP3-7.0, and SSP5-8.5 describe a spectrum of climate transformations, ranging from mild (SSP1-2.6) to extreme (SSP5-8.5): SSP1-2.6 focuses on sustainability by aggressively reducing emissions, SSP2-4.5 adopts a moderate approach to tackle climate change, SSP3-7.0 emphasizes economic growth with less focus on the environment, and SSP5-8.5 prioritizes economic growth with minimal emission control.
Reference :Riahi K, van Vuuren DP, Kriegler E, et al. The Shared Socioeconomic Pathways and their energy, land use, and greenhouse gas emissions implications: an overview. Glob Environ Change 2017; 42: 153–68.
 |
Figure 1. The study utilized data from 707 locations and conducted the projection under different scenarios. The colors in the figure represents different levels of average daily mean temperature in each location. The shapes represent five climatic zones. © 2024 Madaniyazi L, et al. Published by Elsevier Ltd. This is an Open Access article under the CC BY-NC-ND 4.0 license.
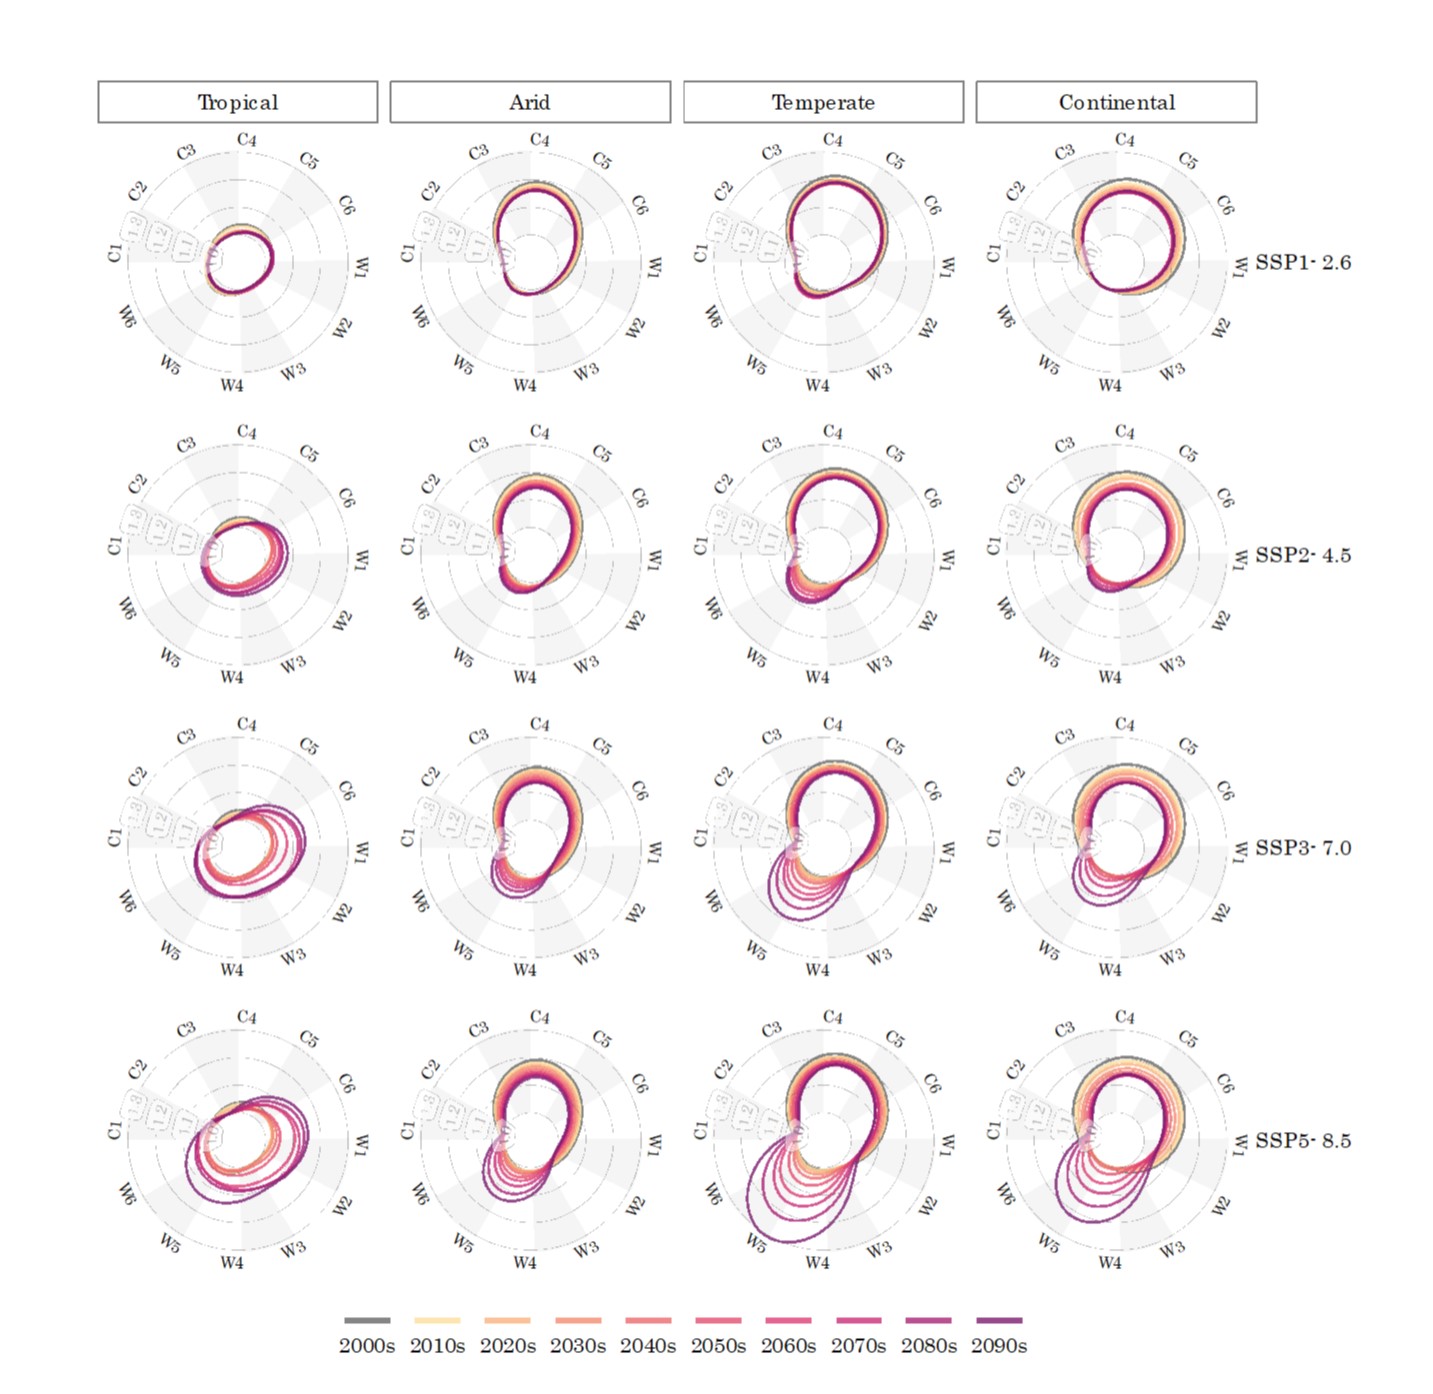 |
Figure 2. This figure shows the seasonality of mortality in four climate zones from the 2000s to 2090s under the four climate change scenarios corresponding to increasing emissions (Shared Socioeconomic Pathways [SSP] scenarios SSP1-2.6, SSP2-4.5, SSP3-7.0, and SSP5-8.5). W1-W6 represents the months in warm seasons (from Apr to Sep for locations in the northern hemisphere, and Oct to Mar for locations in southern hemisphere), and C1-C6 represent the remaining months in cold seasons. The circles labeled 1.0 – 1.3 indicate the ratio of mortality estimates on each day of the year to minimum mortality estimates. © 2024 Madaniyazi L, et al. Published by Elsevier Ltd. This is an Open Access article under the CC BY-NC-ND 4.0 license.
